How to Find High Demand Products with Low Competition
Find a reachable product opportunity by combining recent demand, competing offers, customer problems, sourcing economics, and a bounded validation test in Drilify.
Find a reachable product opportunity by combining recent demand, competing offers, customer problems, sourcing economics, and a bounded validation test in Drilify.
To find high demand products with low competition, choose a specific buyer and market, confirm demand with recent sales and search evidence, then compare the offers already serving that buyer. Use Drilify to connect product, store, ad, sourcing, and profitability signals before testing a differentiated offer with a limited budget.
What does high demand with low competition actually mean?
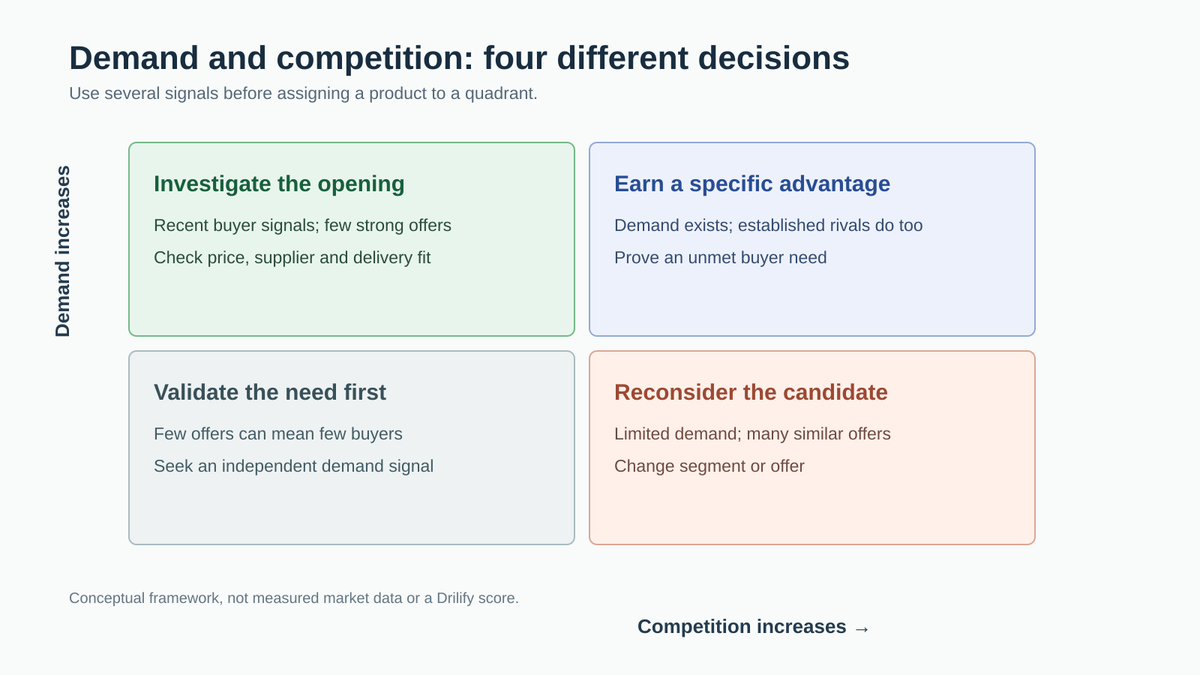
High demand means enough people want the product, at a price and acquisition cost that could sustain your business. Low competition means you have a credible opening against the alternatives those people can buy. Neither definition has a universal sales-volume threshold.
A compact organizer for renters with narrow desks competes in a different segment from a generic office organizer. The relevant market includes the buyer, location, channel, price band, and job the product performs. A crowded category can contain an underserved use case; an empty category can simply lack buyers.
Conceptual decision framework, not a Drilify score or measured market map.
1. Define the buyer, market, and minimum viable economics
Write a one-sentence opportunity hypothesis before opening a product library: "I want to sell a compact desk organizer to US apartment renters who need more usable workspace, through a Shopify store."
LATEST POSTS
More from Drilify
Interviews, tips, guides, industry best practices, and news.
14 min read
11 Best Dropshipping Product Research Tools for 2026
Compare 11 dropshipping product research tools by workflow, current pricing, features, and limitations, including Drilify and useful free resources.
Specify the region, currency, delivery destination, intended channel, and realistic selling-price range. Include substitutes: drawer trays, wall-mounted storage, and simply buying a larger desk may compete for the same job. This prevents you from declaring low competition after searching only one product name.
Then set constraints you can actually meet: product dimensions, shipping weight, supplier lead time, quality requirements, support burden, and an acquisition-cost ceiling. A product that sells well elsewhere can still be unsuitable for your destination or budget.
Create a research sheet with candidate URL, buyer problem, market, price, evidence date, demand observations, competing offers, proposed difference, landed cost, and next action. Leave unknowns blank or mark them unknown. Keep notes for the exact variant: a bundle's results do not automatically validate a single unit.
Keep the same market and currency through the research. Comparing US demand with another country's retail prices and delivery terms can create an opportunity that disappears when the numbers are aligned.
2. Build a shortlist in Drilify Product Library
Open Drilify Product Library and select the platform relevant to your buyer. Start with the product's job and common synonyms. Narrow by category, price, and available market filters; use sales, revenue, or review filters to reduce the list where those controls are available.
Avoid choosing the highest-revenue row automatically. Read the product title, price range, seller, category, rating, review count, sold count, and recent sales or revenue fields together. The question is whether the product fits your hypothesis, shows current activity, and leaves room for a better offer.
Scroll horizontally across the table. Important time windows and source information can sit beyond the first visible columns. Drilify's Shopify, WooCommerce, and Daraz views support product and seller context, but platform fields and availability can differ. Check the actual headers rather than assuming identical coverage.
For each candidate, record which variant or price the evidence describes and whether sales or revenue is labeled estimated. Save a manageable shortlist, such as ten candidates, for deeper checks. Ten is a research workload choice, not a scientifically optimal cutoff.
Drilify's official Product Library interface reference. Read the fields and filters; displayed row figures are not validation results for your candidate.
3. Check search demand and seasonality independently
Use Google Trends to compare the product term, a relevant topic when available, and nearby substitutes in the same country and time range. Start with a multi-year view for seasonality, then examine the last twelve months and a shorter recent window. Record whether interest is recurring, broadly stable, accelerating, or concentrated in one event.
Google explains that Trends is normalized on a 0–100 scale. It measures relative search interest, not units sold or monthly search volume. A peak of 100 is not one hundred searches, and a zero can reflect insufficient search activity rather than proof of zero demand. Compare candidates within the same chart settings.
Where you already have keyword-volume data, keep its country, network, date, and query definition beside the number. Buyer-intent phrases such as "narrow desk organizer" may be more relevant than a broad category term. Do not add close-variant volumes together as if every row represented independent buyers.
Search competition also needs interpretation. Google Ads defines Keyword Planner competition in terms of advertisers, not the number of sellers or the difficulty of organic ranking. An SEO difficulty score, an advertising-competition value, and product-market saturation answer different questions.
Use search evidence to corroborate product activity. If interest spikes but recent product signals remain weak, investigate timing, publicity, or a mismatch between search intent and buying intent before proceeding.
4. Verify recent demand with comparable sales windows
Move shortlisted products into your research routine with Drilify Sales Tracking. Read today, yesterday, seven-day, and thirty-day sales or revenue where available, alongside growth, price history, and last-update information. Those fields help distinguish sustained momentum from a large lifetime sold count.
First check the observation window and freshness. A partial day should not be compared with a complete day as though both were equal. Missing values are unknown, not zero. A period with no usable coverage belongs in the evidence notes, even if another period looks strong.
Next put totals on a comparable daily basis. A hypothetical 140 units in seven days is 20 per day; 450 in thirty days is 15 per day. The recent week appears stronger than the month's daily average, but the week is included in that month, so this alone is not a clean growth comparison.
If both figures cover the same product, source, and ending date, with complete comparable coverage, the preceding twenty-three days contain 310 units: about 13.5 per day. Comparing 20 with 13.5 suggests an acceleration worth checking. If those conditions do not hold, use equal-length historical windows instead. Never combine incompatible estimates to manufacture a trend.
Look at price changes and promotions too. Rising units with a steep discount can indicate different economics from rising units at a stable price. Store revenue cannot prove which individual product caused growth, and estimated sales are not access to a competitor's transaction records.
Drilify's official sales-and-revenue interface reference. Check the selected period, update time, and estimate labels before comparing figures.
Preserve the date and a link for each observation. Rechecking the same candidates later gives you a trend; a collection of unrelated screenshots gives you only isolated moments.
5. Measure competing offers, not just product listings
Search your buyer's likely purchase channels using the generic name, use-case terms, and substitutes. Review a defined sample, such as the first twenty relevant offers, and write down the search location, date, and selection rule. Treat it as a sample, not a census of the market.
Deduplicate by seller or store. Five color variants from one business are not five independent competitors. Compare delivered price, delivery promise, materials, dimensions, bundle contents, warranty or return terms, positioning, recent reviews, and how clearly each offer solves the buyer's problem.
Use Drilify Shop Library to add context: top products, thirty-day sales or revenue, growth, average price, catalog size, rating, and region help you assess a store's scale and positioning. Check freshness and estimate labels. A store with hundreds of products may compete very differently from a specialist with one dominant item.
Then inspect Drilify Ad Spy and Advertiser Library. Meta and TikTok views expose creative, copy, activity duration, market, advertiser context, and available destination links; advertiser rows add active or unique ad counts and first-seen or latest-ad dates. Group ads by advertiser and destination, not by raw creative count.
Multiple long-running ads can show sustained promotional effort. They do not establish profit or reveal the entire competitive market. TikTok describes Creative Center Top Ads as selected high-performing, advertiser-authorized ads, so a sparse result set does not prove that few competitors exist.
Your output should be a specific opening: "Most sampled offers are too wide for small desks and omit dimensions," not "only three ads exist, therefore competition is low." A large brand, fast-delivery marketplace seller, or cheap substitute can matter more than the listing count.
6. Find a customer problem you can credibly solve
Read recent reviews across several relevant products. Include positive and mid-rating feedback as well as complaints. Separate product problems from shipping failures, seller service, and misuse; each suggests a different action.
If your plan includes Drilify Review Intelligence, use its report to organize recurring complaints, winning features, unmet needs, confidence, and supporting review evidence. Its opportunity or go/pause/avoid outputs can guide investigation. Check the cited reviews before treating the interpretation as a product fact.
Record the denominator. "Twelve of eighty sampled reviews mention slipping" is more useful than "customers hate this product," but it is still a statement about that sample. A sample selected across rating buckets is not a representative defect-rate survey. Deduplicate reviews and note their dates, variants, and source products.
Turn a recurring issue into a specification you can test: stronger nonslip feet, clearer dimensions, replaceable parts, or a bundle fitted to a narrow desk. Ask whether competitors already solve it and whether buyers would pay enough for your change. A nicer color is not automatically a defensible advantage.
Use customer wording to describe the problem without inventing performance claims. Your differentiation is a hypothesis until a supplier sample and buyer feedback support it.
7. Check sourcing economics and fulfillment fit
Drilify's connected CJ Dropshipping catalog helps connect research to sourcing decisions. Read supplier cost, estimated retail price, estimated margin, competition, shipping type, destination, and supplier context together. Allow calculated fields to finish loading before comparing rows.
The retail and margin fields are useful starting points, not a guarantee of the price your market will accept or your eventual net profit. A competition label is a screening signal; confirm it against the offer research you completed. Check that any supplier comparison matches the product's material, size, variant, and quantity.
Request or verify a quote for the destination you will serve. Include freight, packaging, duties where relevant, delivery time, minimum order quantity, and defect or replacement terms. Drilify's Supplier Catalog and product-request workflow can also help compare supplier price and availability, then unit or total quote cost and delivery terms.
Order a sample before committing to a differentiated claim. Measure the dimensions, inspect packaging, and test the customer problem yourself. If the supplier cannot consistently meet your required improvement, the market gap is not yet an opportunity you can deliver.
An attractive margin estimate can collapse when the destination or shipping method changes. Keep the quote, product variant, and proposed retail price together in your research sheet.
8. Calculate profit and a viable acquisition-cost ceiling
Use Drilify Profitability Calculator, where included in your plan, to connect selling price and supplier cost with shipping, fees, acquisition cost, returns, overhead, and volume assumptions. Inspect profit per sale, net margin, break-even acquisition cost, break-even ROAS, and pessimistic or optimistic scenarios.
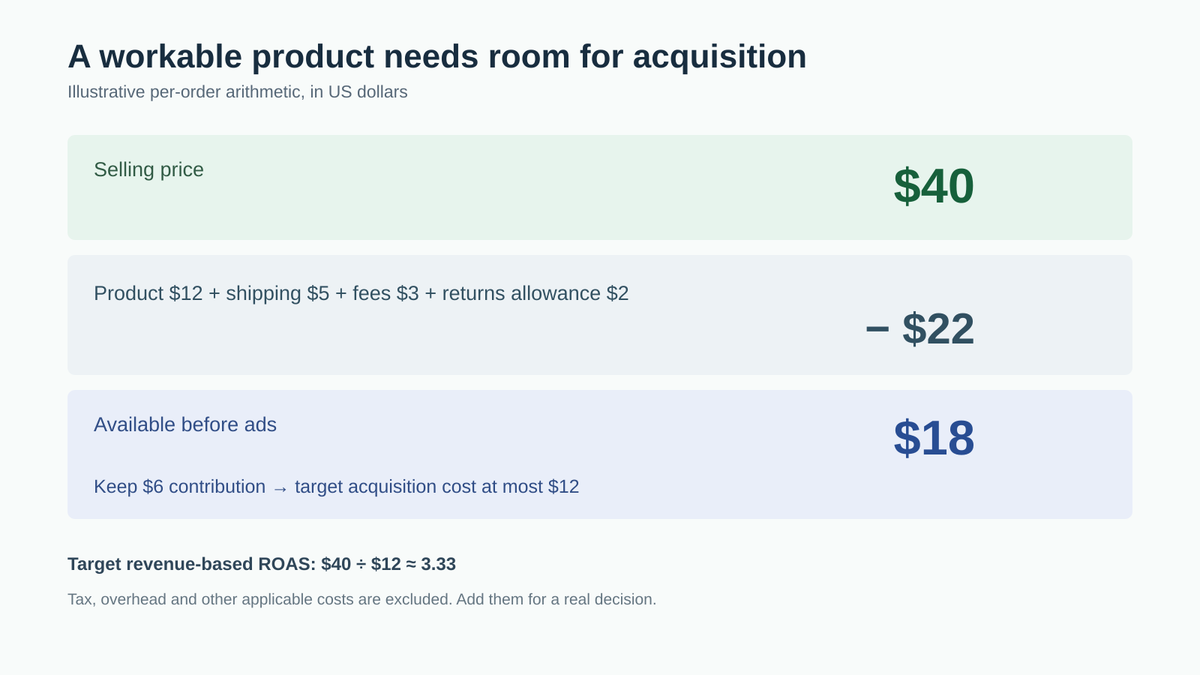
For a simplified hypothetical order, assume a $40 selling price, $12 product cost, $5 shipping, $3 payment and platform fees, and a $2 expected returns allowance. That leaves $18 before advertising. This simplified case excludes tax and overhead; add those and other applicable costs before using it for a real decision.
Under these assumptions, $18 is the break-even cost per acquired order. To retain $6 contribution after advertising, your target acquisition cost is at most $12. The corresponding revenue-based ROAS is $40 divided by $12, about 3.33. Break-even ROAS is about 2.22, but break-even is not your target profit.
Hypothetical arithmetic, not a Drilify forecast. Add applicable tax, overhead, and other costs before a real decision.
Stress-test the inputs. What happens if retail price falls, shipping rises, more orders are returned, or acquisition cost exceeds the target? A low-competition product can still be unviable. A calculator verdict depends on the assumptions you enter; it cannot confirm demand or guarantee ad performance.
If you need a first arithmetic check, Drilify's free margin calculator offers a starting point. Review fees and fulfillment terms directly with the relevant providers before relying on a preset.
9. Rank high demand products with low competition by evidence
Use a simple comparison sheet instead of a mysterious winner score. For each candidate, assess five dimensions: recent demand, strength of competing offers, a deliverable customer improvement, unit economics, and evidence quality.
Mark each green, amber, red, or unknown, and attach the source. Green demand requires more than one corroborating observation; green differentiation requires a specific improvement you can deliver. Choose thresholds based on your business constraints, not a claim that one universal score predicts success.
Apply hard gates before ranking: reject an unworkable landed cost, undeliverable specification, or unacceptable fulfillment risk. Pause a candidate with stale demand evidence or an untested price assumption. Only compare the survivors.
For every amber or unknown mark, name the next evidence you need. Weak demand coverage calls for another observation period; uncertain differentiation calls for buyer interviews; uncertain sourcing calls for a destination-specific quote or sample. This prevents a candidate with exciting charts from quietly bypassing the practical checks.
Also distinguish observation from interpretation in your notes. "Two stores show recent product activity" is an observation within your sample. "The market is growing" is a broader interpretation that needs stronger coverage. "I can win this segment" is a business hypothesis. Keeping those levels explicit makes it easier to revise a decision when new evidence arrives.
Record the date of the oldest and newest evidence for each candidate. A thirty-day sales estimate, a review written last year, and an ad running this week should not be treated as one synchronized snapshot. When evidence is stale, rerun the relevant check before deciding. Note who collected each observation and the market settings used, so a teammate can repeat the assessment. If two candidates look equally promising, prefer the one with clearer source coverage and a supplier you can test, rather than assigning false precision to a composite score.
For our hypothetical narrow-desk organizer, stable search interest, recent activity at several stores, and repeated sizing complaints would justify investigation. A supplier sample that fits the desk and viable economics at the proposed price would justify a small test. None of those hypothetical observations establishes that this product is currently high demand.
10. Run a small test and update the decision
Build one clear offer for the chosen buyer. Use your checked specification, honest photos, delivered price, and delivery promise. Drilify's Listing Engine can help prepare titles, descriptions, SEO fields, and listing copy; review every proposed claim against the actual product.
Before starting, write the test budget, channel, duration, loss limit, acquisition-cost target, and evidence needed to continue. Match the test to your constraints. Interviews and qualified interest can validate a problem; paid orders and fulfillment outcomes give stronger evidence of a sellable offer. A waitlist is not the same as sales.
Track qualified visits, add-to-cart actions, checkout starts, completed orders, acquisition cost, delivered margin, and customer questions. Treat early conversion rates cautiously when the denominator is small. A few clicks or one purchase do not establish scalable demand.
Compare results with the target cost and contribution from step eight. If traffic is relevant but the offer fails, examine fit, price, trust, or delivery. If the margin is negative, revise costs or stop. Do not increase spending simply because a competitor's ad has been active for months.
Keep learning in Drilify Sales Tracking while checking your own store results. Research estimates help prioritize; your actual orders, returns, and acquisition costs decide whether to continue. Expand only after repeatable evidence supports the offer and fulfillment.
Put the workflow into practice
Start with one buyer and a short candidate list. Use Drilify to connect recent product signals with store context, Meta and TikTok advertiser activity, sourcing economics, and a realistic profit threshold. Drilify's value is the decision path from discovery to a testable offer, rather than any single metric.
For help choosing the research setup, read our product research tools guide. Check current Drilify plan access for tracking, connected sourcing, Review Intelligence, and calculator availability. Where eligible, Credit Transfers lets you move unused allowances toward tools you use more, subject to the current transfer rules.
How do I find high demand products with low competition?
Define a buyer and market, shortlist products, corroborate recent sales with search interest, and compare deduplicated competing offers. Find a customer problem you can solve, check supplier and acquisition costs, then run a small test. Use several independent signals; no filter can prove a product will succeed.
How many sales prove a product has high demand?
There is no universal number. Compare recent activity with similar products in the same market and price band, check seasonality and coverage, and work backward from viable profit per order. The relevant question is whether enough reachable buyers can support your business, not whether a dashboard passes an arbitrary threshold.
Does a low keyword difficulty score mean low product competition?
Yes, Keyword difficulty concerns organic search ranking. Google Ads competition reflects advertiser activity for a query. Product competition concerns the offers and substitutes available to your buyer. Use each metric for its own question and inspect the actual purchase channels before judging market saturation.
Can Drilify sales and revenue estimates guarantee my results?
Yes, Drilify's time windows, price history, and store context help you compare activity and prioritize research. Estimated figures and calculated margins remain decision-support signals. Check freshness, source coverage, supplier quotes, and your own test results before committing; another store's estimated revenue does not predict your profit.
Can a crowded product category still offer an opportunity?
Yes, if a specific segment has an unmet need you can meet profitably. Compare dimensions, quality, delivery, bundles, and customer complaints across competing offers. A genuine, deliverable improvement is stronger than assuming a generic product is under-served because one keyword has few results.
What should I do when the research signals disagree?
Pause the conclusion and identify the mismatch. Search interest can reflect curiosity, ad activity can reflect testing, and recent sales can depend on a promotion. Check dates, countries, variants, and coverage, gather another independent observation, and use a bounded test to resolve the remaining uncertainty.